

The Cost of Waiting: What May Happen If India's Festive Demand Doesn't Lift

Updated: Oct 16
Three piles of inventory are sitting in this market going into Diwali. They contain the same phones, and they are not the same asset. The number that separates them is not age. It is what it costs to keep holding them, and that number turns on a memory forecast nobody agrees on.
Everybody is watching the demand number. The interesting number is the exit.

The festive question across the trade is whether demand lifts. It has two answers, and both are already in everybody's deck. The more useful question is what each stockholder can actually do if it doesn't.
And it is worth being precise about who is holding, because the industry keeps describing this as two sides. It is three.
The official trade holds brand-mapped, serialised stock inside a commercial relationship that has a phone number attached to it. The marketplace layer holds inventory listed on e-commerce platforms, sold by a mix of brand-appointed e-tail partners and third-party sellers whose provenance varies considerably. The aggregator layer holds stock bought at arm's length, outside both.
All three bought for the same reason, and it was not a foolish one. In an inflationary component cycle, holding inventory is normally the smartest position in the room. You buy at today's list, the brand revises upward, and stock that has not moved has still made money. That trade has worked for four consecutive quarters.
What has not been tested is the exit. And this is not a story about ageing inventory. Stock bought two or three months ago was a rational decision when it was made. Inventory does not become dangerous because it gets old. It becomes dangerous when the market stops absorbing it at the price and the speed at which it was acquired.
What is settled, and what isn't
The trackers disagree, so it is worth separating what they disagree about from what they don't.
Q1 2026: IDC has 31.0 million units, down 4.1 percent. Omdia down 5. Counterpoint 2 to 3 percent down, the weakest first quarter in six years. Q2: IDC 33.2 million, down 11.1 percent. Counterpoint down 10, the steepest June quarter in six years. CMR down 10. Omdia 13, at roughly 33.9 million. Smart Analytics Global 8.3.
On the level, everybody agrees. IDC has H1 at 64.2 million, Omdia at 64.8, within one percent. Only the slope is contested, and the slope argument is mostly an argument about 2025.
But in H2 the trackers disagree about direction, not just magnitude, and that is new. IDC expects the second half to decline more than 15 percent, landing the year at 128 to 130 million. Counterpoint forecasts around 13 percent for the year, with H2 performing better than H1 as the festive season provides support. CMR has 10 to 12 percent. Those are opposite shapes for the exact period this article is about. Anyone quoting a full-year number without saying which half-year shape it assumes is quoting an average of two incompatible views.
Three Q2 numbers matter more than the headline.
ASP hit a record ₹30,000, up 14.4 percent, roughly $315. Memory has risen around four times over three quarters. Omdia recorded entry-level increases of 18 to 20 percent, and Counterpoint found mass-market prices rising by an average of ₹3,200 between April and July.
Value did not fall. Up 1.7 percent in Q2, up 3.6 percent across H1, while volume fell.

Mainline (Offline) moved from 53.6 to 58.1 percent share, declining 3.6 percent, while online fell 19.8 percent. Online did not slow. Online fell off a cliff, and that has direct consequences for the second and third piles.
The front-loading is documented rather than inferred. IDC said Q1 shipments came in above expectations because brands front-loaded channel inventory ahead of anticipated memory cost escalation. Smart Analytics Global said the same for Q2, attributing the beat to Chinese vendors building festive stock early to lock component supply. Omdia said the same of Apple. The stock is already in the trade. That part is not a scenario.
The number itself
Age tells you nothing. What matters is the rate at which holding consumes the margin the stock was bought to earn.
Break-Even Hold = gross margin ÷ monthly cost of waiting
Where the monthly cost of waiting is the carry on the money plus whatever the market price is doing each month. The output is in months. Compare it against how long the stock has actually been held.
Take a cost of money of 12 percent a year, which is one percent a month, and an illustrative four percent gross margin. Both are assumptions, and the reader should substitute their own; the shape of the answer does not change.
At one percent a month and stable prices, Break-Even Hold is four months. Stock bought two to three months ago has already consumed half to three-quarters of the margin it was acquired to make, before festive has even started.
Add one percent a month of price erosion, and it halves to two months. At that point the position is already past break-even, and every further week is a realised loss, not a deferred gain.
A single 11 percent repricing event clears no holding period at all at a four percent margin. There is no month at which waiting recovers it.
And if prices keep rising at one percent a month, the denominator goes to zero, and Break-Even Hold is infinite. Holding costs nothing. It pays.

That is the whole argument, and it is why this piece cannot end with a verdict. Every one of those four outcomes is live right now, and which one applies depends entirely on a memory forecast the industry does not agree on.
The construct also explains the difference between the three piles without any handwaving. Official-channel stock carries a smaller denominator on both terms: brand channel finance is cheaper than market money, and price protection removes most of the erosion term outright. Same phone, same carton, materially longer Break-Even Hold. The asymmetry between the piles is not the stock. It is the denominator.
The ₹25,000 line is real. It is not where the industry keeps putting it.
The working assumption is that EMI matters above ₹25,000. That figure survives partially.
As a segment boundary, it is entirely real. CMR uses it to define premium. The Grant Thornton Bharat and Policy Watch India Foundation whitepaper proposes it as the GST rate break.
As a financing threshold, it understates the case. Counterpoint's 2025 read had financing at 40 percent of mainline volume, with nearly two-thirds of purchases above ₹30,000 financed. The 2026 read has financing at 42 percent of total sales against 35 percent in 2025, above 50 percent in mainline, and above 55 percent in both Tier 2 and Tier 3 and beyond, against 41 percent in Tier 1. Average tenure is 10 months. Apple runs 17.2. Samsung leads the market on financed units.
Corrected: above ₹25,000 EMI is not a major factor, it is close to the default. And the smaller towns are now more financing-dependent than the metros, not less. Which inverts the received wisdom about where unmapped stock clears easily.

The mechanism is simple enough. Financing is extended against mapped inventory. Where a phone can be turned into a monthly commitment, it competes on the outgo. Where it cannot, it competes on the sticker, and the sticker is not the number the buyer is deciding on.
Where the number lies to you
Every framework has a place where it misleads, and it is better to name it than to wait for somebody else to.
Break-Even Hold treats price erosion as smooth and monthly. It isn't. A GST decision or a competitor's clearance is a step change, not a drift, and a step change can arrive inside a month that the model would have called safe.
It also assumes a single margin across a book. Real inventory is a spread of SKUs with very different price risk. A hero model at velocity and a stranded variant do not share a break-even, and averaging them hides exactly the position that needs attention.
And the marketplace pile does not sit cleanly at either end. Third-party sellers can attach card- and platform-funded EMI without brand subvention, and platforms fund their own festive discounting. That is a partial exit my framing would otherwise deny exists. The qualification that keeps it interesting is that this partial exit is the one contracting fastest, with online down 19.8 percent while offline fell 3.6.
What survives all three caveats is the direction. The three piles face materially different costs of waiting, and the differences are structural rather than commercial.
What may happen to each pile?

The official trade is squeezed rather than trapped. The binding constraint becomes the credit line rather than the demand curve: a dealer on a fixed rupee line stocks roughly 13 percent fewer units at a 14.4 percent higher ASP while sell-out slows, so inventory days rise on both sides. That is arithmetic. What follows is a narrowing of assortment to a handful of fast movers with financing attached, and Omdia's "others" block falling 21 percent is what that looks like from outside.
The stress is already visible in the trade body's messaging. AIMRA has advised retailers to arrange independent bank finance to buy stock in cash, warning that distributors are prioritising cash-paying buyers on short-supply models, and has asked the government to raise the MUDRA ceiling for mobile retailers from ₹20 lakh to ₹30 lakh. When an association lobbies on working capital rather than margin, the pressure has moved to the balance sheet.
Supply is simultaneously uneven, which may compound rather than offset. Per AIMRA, vivo stores that normally carry 30 days are down to five to seven; Realme's P and C series and Nothing are hand-to-mouth; Poco is near-zero in general trade; and only Samsung and Xiaomi have been holding normal 21-to-30-day entry-tier stock. A channel can be overstocked in the wrong SKUs and stocked out in the right ones at the same time.
The marketplace layer carries the sharpest volume exposure of the three. It has partial access to financing and to platform-funded promotion, which shortens its cost of waiting relative to the aggregator. It is also the channel that has already lost a fifth of its volume year on year. If festive online events produce spikes rather than a sustained lift, platform sellers may find themselves discounting into a shrinking base with the funding support arriving late.
The aggregator layer carries the longest denominator and the fewest instruments. And here the second-order consequence runs toward the brands rather than away from them: if this layer stops buying, reported share for online-dependent labels falls faster than end-consumer demand does, because some of what was booked as online sales was never a consumer purchase.
A caution on how that will be read. iQOO's 61 percent decline is the ready-made illustration, and it is probably the wrong one. The Intent Index work put iQOO's search share essentially at par with its shipment share, which points to supply withdrawal rather than demand loss or aggregator retreat. The mechanisms look identical in a headline and are not the same thing.
The October 7 problem
The 57th GST Council meeting was scheduled for September 12. It has been rescheduled to October 7 by office memorandum from the Council Secretariat, after the original date clashed with the BRICS Leaders' Summit in New Delhi on September 12 and 13. Officers' meetings now run on October 5 and 6.
A reduction in the 18 percent GST on handsets is on the radar, though the agenda has not been circulated and nothing is settled. The discussed structure is 5 percent below ₹25,000 with 18 percent retained above. The policy case is substantial: mobile phone production was ₹6.27 trillion in FY26, roughly half of India's ₹13.11 trillion electronics output.
Now put it on the calendar. Diwali falls on Sunday, November 8, Dhanteras on November 6. The Council meets on October 7. That is 32 days. Festive sell-in runs four to six weeks ahead of the peak, so the decision lands on top of the stocking window rather than before or after it. The trade must commit working capital either just before that date without knowing, or just after it with no time left.
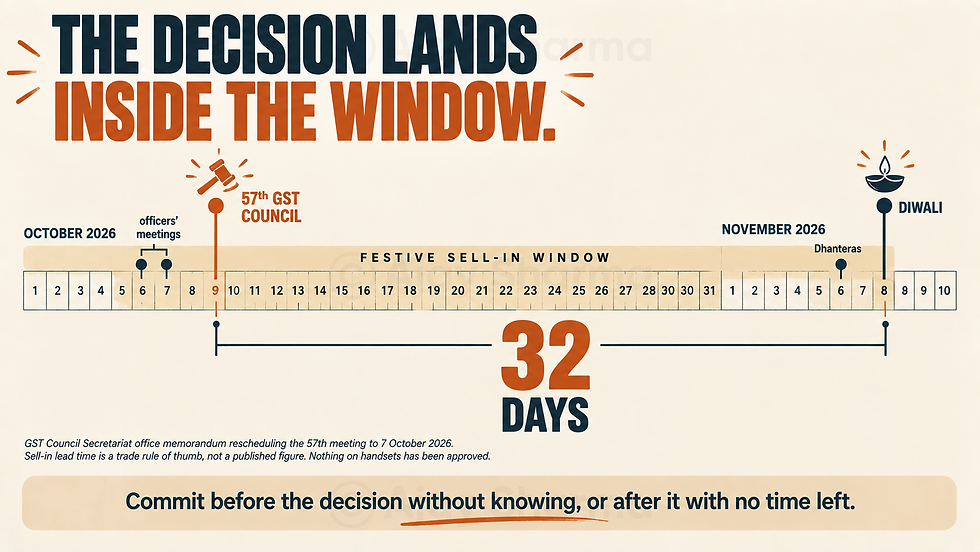
If a cut happens, the consequences are not symmetric. For mapped stock there is a mechanism: credit notes and price protection, slow and argued over, but with a counterparty. For unmapped stock the entire reprice is absorbed by the holder, and what is left is an input tax credit position rather than an offset. Notably, the inverted duty structure is itself on the October 7 agenda, alongside the question of whether earlier rate reductions were actually passed on to consumers. Anyone modelling this should have it read by a tax adviser rather than taking this framing as settled.
Two further notes. A break at ₹25,000 creates an immediate incentive to engineer SKUs to land at ₹24,999 and orphans anything currently between ₹25,000 and ₹30,000. And an NIPFP study from March 2026 found mixed evidence that past GST reductions transmitted to consumer prices, which is presumably why transmission is on the Council's own agenda. A rate cut is not automatically a price cut.
Three exits, and what each costs
Export. Real, narrow, and slow. Region-locked variants, band support, destination certification, and source-side restrictions cut the eligible SKU list quickly, and warranty does not travel, which caps the realisable price. The models with genuine global pull are Apple and premium Samsung, which are the SKUs this layer holds the least of. The binding constraint is time: an export runs a documentation-to-realisation cycle materially longer than the aggregator's normal turn, which means it adds months to exactly the term the Break-Even Hold is dividing by. Export is a SKU-specific liquidity option, not insurance against inventory risk.
Release below channel price. The industry reads this as panic. The arithmetic says otherwise. If holding costs one percent a month and the market price is falling, the loss from waiting can exceed the margin sacrificed by selling today. Selling below cost is not necessarily panic. It can be cash preservation, and gross margin and cash recovery are not the same thing.
That does not make it harmless. If volumes are large enough, the lower price becomes a market reference; the official channel either matches or loses credibility at the counter, retailers escalate to brands, and consumers start waiting for the next cut. There is precedent for brands tolerating rather than policing the leakage: per AIMRA, after OnePlus halted general trade operations from March, the brand appeared content to let online stock bleed into general trade through the grey channel. One holder's velocity problem becomes another's pricing problem.
Hold. This is where the article has to stop and hand the decision to the reader, because the input is genuinely contested.
SK Hynix CEO Kwak Noh-jung has said the memory shortage will persist through the end of 2030, with 2027 the worst year in the industry's history from a supply perspective, extending the company's own earlier guidance of 2028. Samsung and Micron have pointed to 2028. Omdia's read for smartphone-relevant normalisation is H1 2027, possibly end 2027. Bloomberg Intelligence dissents entirely, arguing the worst may have peaked in H1 2026, with pricing stabilising through 2027 and possible oversupply by 2028.

Those four views produce four different Break-Even Holds on identical stock. On the SK Hynix read, prices keep rising, the denominator goes toward zero, and holding is not the desperate option; it is the winning one. On the Bloomberg read, prices soften from here, the denominator widens, and every week of holding is a realised loss.
The uncomfortable part is that the choice is not really analytical. Holding requires funding. If the market splits this way, the differentiating variable inside the aggregator layer is not judgement about memory. It is access to capital, and the consequence is consolidation rather than collapse: a smaller number of better-funded players end the cycle with stronger source relationships.
Who is least exposed, and where

Samsung is the most insulated on H1 data. IDC has shipments up 0.4 percent with share moving from 14.5 to 16.4; Counterpoint records it as the only top-five brand to grow, at around 2 percent; it gained share in every tracker. Being the largest memory producer during a memory shortage makes part of the cost inflation an internal transfer while competitors take a pure margin hit, and it holds the largest financed-unit base in the country.
The Intent Index qualifier still applies and applies harder here. Samsung's search share sits at 13.1 against roughly 16.5 percent shipment share, an index of 0.79, which describes allocation rationed to it by a credit-constrained trade rather than demanded of it by consumers. Push-led share is real share, and it is conditional on the conditions that produced it.
Apple requires care, because the trackers are measuring different things. IDC has 2.82 million, up 0.7 percent, citing supply shortage. Counterpoint has it down 3 percent while separately recording Apple as the fastest-growing brand on sell-through between April and July, up 15 percent. Omdia and SAG both have 3.5 million and up 12 percent, attributing it to channel inventory build for the base iPhone 17 ahead of price increases. Those readings reconcile: part of Apple's strong Q2 print is channel fill, and that stock is in the trade now, going into festive. Apple's structural protection is arithmetic, since a memory-driven cost increase is a far smaller proportion of an ₹80,000 device than of a ₹12,000 one. IDC expects iPhone shipments to decline mid-single digits in 2026 from 14.3 million in 2025.
Most exposed: iQOO down 61 percent, realme down 14.2, vivo down 13.9 despite retaining leadership, Xiaomi down 10, OnePlus withdrawn from general trade. Nothing grew 105 percent off a small base. OPPO held relatively well, down 8.5 with share up. On vivo, the Intent Index reading of 0.96 describes a brand whose buyers were priced out rather than one whose buyers left, which matters for recovery speed rather than current damage.
By segment, the market hollowed out from below rather than shrinking evenly. Sub-$100 shipments fell 74.3 percent in Q2 with share collapsing from 15.6 to 4.5 percent. Counterpoint has sub-₹15,000 down 45 percent. CMR has its affordable band down 88 percent and value-for-money down 30 percent, while premium above ₹25,000 grew 54 percent and the ₹50,000 to ₹1 lakh band grew 72. The $400 to $600 band grew 60.3 percent.
That is not premiumisation in the sense the marketing decks mean. The bottom rung was removed, and buyers stepped up because there was nothing left to step onto. Counterpoint's consumer survey of 2,095 prospective buyers found 46 percent willing to stretch their budget despite a price increase, 25 percent intending to delay, and 29 percent staying within budget or going refurbished. The middle number is the one that threatens inventory, and the third is the one that leaves the market entirely. Techarc's work suggests roughly 7 percent of planned festive buyers may go secondary instead, around six million units, and India's refurbished market has been growing while new volumes decline.
What would prove this wrong?
This is the part most inventory commentary skips, and it is the honest test.
If sell-through accelerates, retailer inventory days fall, distributor replenishment picks up, discounting stabilises, financing conversion improves, and the price gap between mapped and unmapped stock narrows rather than widens, then the cost of waiting never bites, and none of the above is tested.
The evidence against an inventory-overhang thesis is simply that the inventory moves. Not shipments. Not sell-in. Not festive GMV headlines, which measure a share of online spending rather than a share of the market and should not be read as the latter. Actual consumer sell-through, week by week.
Worth watching against that: Counterpoint's weekly sellout tracker had April to July running largely below year-ago levels, with promotional events producing temporary lifts rather than a sustained reset.

What each party may do?
Brands can re-point H2 incentives from sell-in to sell-out, monitor inventory at SKU level rather than in aggregate, publish a written price-protection position with an explicit GST contingency ahead of October 7 since the uncertainty is itself suppressing stocking, and fund tenure rather than depth, because extending no-cost EMI does not reset a price anchor that cannot be raised again in an inflating cycle.
The official trade can make financing attach rate the primary counter metric ahead of margin per unit, get GST protection in writing before committing festive working capital, substitute pre-booking for holding where the SKU allows, and build the trade-in bench, because the buyer walking out is going secondary somewhere.
Aggregators and marketplace sellers can calculate cash recovery rather than theoretical margin, run Break-Even Hold at SKU level rather than across the book, hedge October 7 asymmetrically since the discussed proposal leaves stock above ₹25,000 untouched while repricing everything below it, and treat a controlled loss as preferable to uncontrolled depreciation.

The nuanced read
The consensus framing is that this is a demand story with a supply-side cause. Memory went up, prices went up, buyers stepped back. All true, and incomplete in a way that will cost somebody a quarter.
What H1 actually recorded was a reallocation of working capital. ASPs rose 14.4 percent, the same credit line buys roughly 13 percent fewer units, and the trade rationed its shelf to whatever turned fastest with financing attached. The assortment narrowing, the starved second-tier brands, the share handed to Samsung and Apple, and the entire disadvantage of stock that cannot be turned into a monthly payment all follow from that one line.
Which is why the three piles in this market are not the same asset even where they contain the same phone. One of them can wait. One of them can wait a while. One of them is paying by the week for the privilege, and whether that is a disaster or the best trade of the cycle depends on a memory forecast that ranges from normalisation next year to shortage until 2030.
This is not a crisis. It is a test of channel discipline, and the results will show up in inventory days, discounting and channel negotiations well before they show up in the headline market data. By the time they do, the decisions that created the position will already have been made.
Inventory does not go bad because it gets old. It goes bad because the clock keeps running while the market decides whether to show up.

Sources: IDC Worldwide Quarterly Mobile Phone Tracker, Q1 and Q2 2026. Counterpoint Research Monthly India Smartphone Tracker, India Weekly Smartphone Sellout Tracker, Monthly Smartphone Financing Tracker, and consumer survey of 2,095 prospective buyers, 2026. Omdia Smartphone Horizon Service, 1Q26 and 2Q26. CyberMedia Research India Mobile Handset Market Review, Q2 2026. Smart Analytics Global Smartphone 360, August 2026. AIMRA channel commentary via Digit, July 2026. GST Council Secretariat office memorandum rescheduling the 57th Council meeting to 7 October 2026. Grant Thornton Bharat and Policy Watch India Foundation GST whitepaper. NIPFP, March 2026. Techarc consumer survey. Memory outlooks: SK Hynix (CEO comments to Reuters), Samsung, Micron, Omdia, Bloomberg Intelligence. Brand-level shipment shares consolidated at group level by the author. The Intent Index readings referenced are from the author's earlier Q2 2026 analysis. Break-Even Hold is the author's own construction. The 12 percent annual cost of money and the four percent gross margin used to illustrate it are stated assumptions, not published figures, and readers should substitute their own. The proposed GST change on handsets is a proposal under consideration and has not been approved.


Comments